Mi Casa
Condominium · in Choa Chu Kang, District 23, Singapore · 99 yrs from 25/08/2008 · Completed 2012
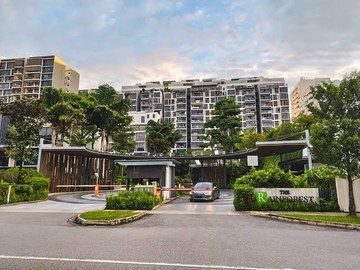
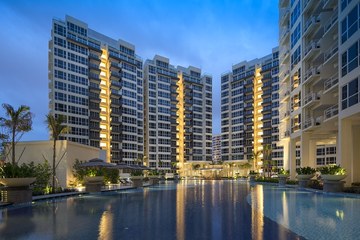
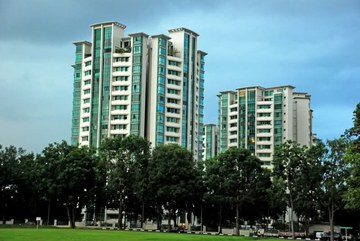
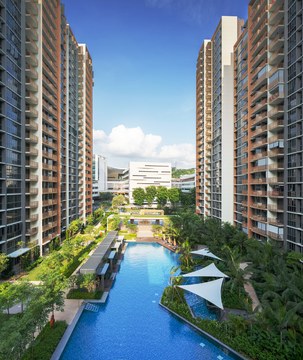
Mi Casa property photo and location
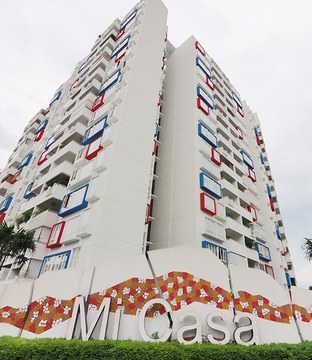
Intro: Mi Casa offers a spacious residential retreat in Choa Chu Kang with a variety of floor plans spanning from two-bedroom units to generous four-bedroom homes 🏡.
Good to know: Located within a short walk of Choa Chu Kang MRT and the convenience of Lot One Shoppers' Mall 🚆; Features 457 units with a layout mix that includes larger configurations up to 2,316 sq ft for family needs 👨👩👧👦.
Practical note: While the community is well-connected, residents should account for the typical pace of suburban life in this established Choa Chu Kang residential pocket.


Mi Casa project details
GLS Site
MRT and LRT stations near Mi Casa
- Choa Chu KangBP1NS4JS1
- South ViewBP2
- Keat HongBP3


Primary schools near Mi Casa
- South View Primary School
- Teck Whye Primary School
- Chua Chu Kang Primary School

Mi Casa price, PSF and transaction trends
Mi Casa transaction volume
Among the latest 12 recorded sales for Mi Casa, the median price was S$1,650,000 and the median PSF was S$1,287 psf. The newest record shown is from 16 September 2026. The annual project median was 41.1% higher in 2026 than in 2019; unit mix can affect year-to-year comparisons.
Recent Mi Casa transactions
| Date | Sale type | Price | PSF | Size |
|---|---|---|---|---|
| 16 September 2026 | Resale | S$1,800,000 | S$1,382 psf | 1,302 sqft |
| 30 July 2026 | Resale | S$1,620,000 | S$1,286 psf | 1,259 sqft |
| 6 April 2026 | Resale | S$2,468,000 | S$1,129 psf | 2,185 sqft |
| 1 April 2026 | Resale | S$1,650,000 | S$1,288 psf | 1,281 sqft |
| 24 February 2026 | Resale | S$1,733,880 | S$1,342 psf | 1,292 sqft |
Mi Casa median transaction PSF (S$)
Mi Casa annual price trend
| Year | Median price | Median PSF | Recorded sales |
|---|---|---|---|
| 2026 | S$1,650,000 | S$1,286 psf | 7 |
| 2025 | S$1,660,000 | S$1,310 psf | 12 |
| 2024 | S$1,520,000 | S$1,233 psf | 19 |
| 2023 | S$1,455,000 | S$1,150 psf | 9 |
| 2022 | S$1,210,000 | S$1,032 psf | 11 |
| 2021 | S$1,170,000 | S$948 psf | 24 |
| 2020 | S$1,150,000 | S$906 psf | 15 |
| 2019 | S$1,177,500 | S$912 psf | 14 |
Mi Casa annualized profit %
Mi Casa rental prices and estimated yield
Among the latest 12 recorded rental contracts for Mi Casa, the median monthly rent was S$4,300, with records ranging from S$3,400 to S$7,000.
Recent Mi Casa rental contracts
| Lease date | Bedrooms | Monthly rent | Est. PSF | Area |
|---|---|---|---|---|
| 1 August 2026 | 4 BR | S$4,000 | S$3 psf | 1200-1300 |
| 1 August 2026 | 4 BR | S$7,000 | S$3 psf | 2200-2300 |
| 1 August 2026 | 3 BR | S$4,300 | S$3 psf | 1200-1300 |
| 1 August 2026 | 3 BR | S$4,500 | S$4 psf | 1200-1300 |
| 1 August 2026 | 3 BR | S$4,100 | S$3 psf | 1200-1300 |
Mi Casa rental volume
Frequently asked questions about Mi Casa
How much do units at Mi Casa cost?
The latest 12 recorded sales show a median price of S$1,650,000 and a median of S$1,287 psf. Actual prices vary by floor, size, facing, condition and sale date.
What are the rental price and estimated yield at Mi Casa?
The latest recorded median monthly rent is S$4,300 and the estimated rental yield based on the past six months is 3.3%. Rental yield is indicative and can vary by unit and costs.
Is Mi Casa freehold or leasehold?
Mi Casa has a tenure of 99 yrs from 25/08/2008.
When was Mi Casa completed and who developed it?
Mi Casa was completed in 2012, the developer is Tian Hock Properties Pte Ltd, and the project has 457 units.
Which MRT or LRT station is nearest to Mi Casa?
Choa Chu Kang is the nearest station shown, at an estimated straight-line distance of 342 metres.
Which primary schools are near Mi Casa?
The primary schools shown within the page’s one-kilometre search are South View Primary School (247 m), Teck Whye Primary School (580 m), and Chua Chu Kang Primary School (915 m). Distances are estimates and do not determine school-admission eligibility.
Data sources and methodology
Sale and rental records are based on URA private residential property market data. REALSMART calculates project-level medians, chart groupings, profitability indicators, straight-line distances and estimated rental yields. Data on this page runs through 16 September 2026. Figures are indicative and do not constitute financial advice.